

The finding in one line: Searching for Korean beauty in English is led by one brand name, Medicube, in 59 of the 73 countries where we could compare brands. The exceptions are the Asian markets where K-beauty is oldest, and India, which searches for ingredients where Western markets search for brands. The countries that news and blog coverage writes about most are different again, and the two maps barely agree.
This article maps demand for K-beauty as it shows up today, market by market. We use three lenses that are rarely read together: monthly search volumes in seven large markets, relative search intensity in 65 countries, and the geography of 12 months of news and blog coverage. We add official export figures from South Korea as a fourth check. A search is a sign of curiosity, not a sale, so “demand” here means search demand unless we say otherwise.
1. The world map: where K-beauty search demand is strong, and what leads it
The map below is the main exhibit of this article. Panel A shows how intensely each country searches for K-beauty, panel B shows which of nine Korean brand names leads search in each country, and panel C shows which of five product, ingredient or look queries leads.
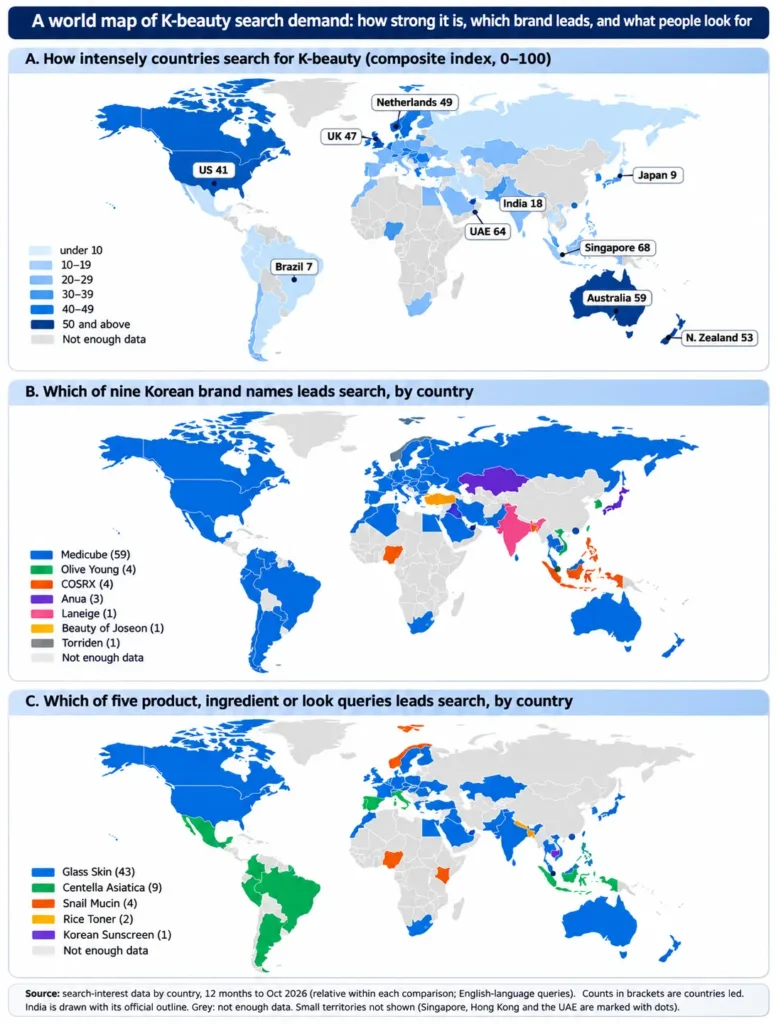
Map: K-beauty search demand by country, 12 months to October 2026 (A: intensity, B: leading brand, C: leading product or ingredient)
Panel A, intensity:
Singapore scores 68 on our 0 to 100 composite, followed by the United Arab Emirates (64), Australia (59), New Zealand (53), the Netherlands (49), Norway (48), the United Kingdom (47), South Korea (46), Canada (45) and the United States (41). Japan scores 9, Brazil 7, Mexico 9, Indonesia 10, Thailand 10 and Vietnam 9. India scores 18. The composite is the average of ten query indices, each scaled so that the highest country is 100; it measures the share of a country’s own searches, not volume, so a small, search-heavy country can outrank a large one. Read the low scores with care: they are English-language queries, and Japan, Brazil, Mexico, Thailand and Vietnam search for this category largely in their own languages.
Panel B, brands:
Medicube leads in 59 of 73 countries. In the nine-brand comparison its share of brand searches is 70 per cent in Paraguay, 65 per cent in Brazil, 43 per cent in the United Kingdom and 34 per cent in the United States. The 14 exceptions are mostly in Asia: the retailer Olive Young leads in South Korea (58 per cent of brand searches), Taiwan (52), Singapore (23) and Vietnam. COSRX leads in Indonesia, the Philippines and Bangladesh, and in Nigeria. Anua leads in Japan, Kazakhstan and Iraq. Laneige leads in India, Beauty of Joseon in Türkiye and Torriden in Norway.
Panel C, products and ingredients:
Among five queries (“glass skin”, “snail mucin”, “centella asiatica”, “rice toner” and “korean sunscreen”), the look “glass skin” leads in 43 of 59 countries, including the United States, the United Kingdom, Germany, Australia, Japan and South Korea. The botanical name “centella asiatica” leads in nine countries: Spain, Portugal, Italy, Mexico, Peru, Brazil, Colombia, Argentina and Indonesia. “Snail mucin” leads in Nigeria, Kenya, Qatar and Norway, “rice toner” in Nepal and Bangladesh, and “korean sunscreen” in Cambodia. The Latin American result probably reflects that the botanical name is also the common name of the plant there; it is a reading, not something the data can prove.
2. How big each market is: the United States by volume, Singapore by person
For seven markets we hold monthly search-volume estimates for 21 queries (six brand or retailer names, three ingredients, seven product types, and five look or general terms). Together they total about 2.42 million searches a month. The United States accounts for 47.2 per cent, the United Kingdom 16.6, India 16.1, Australia 7.9, Canada 7.5, Malaysia 2.4 and Singapore 2.3.
Per head the order inverts. Singapore searches 9.1 times per 1,000 residents each month, Australia 7.0, the United Kingdom 5.8, Canada 4.4, the United States 3.4, Malaysia 1.6 and India 0.3. A retailer choosing where to expand would read the first chart and see the United States, and read the second and see a set of smaller, denser English-speaking markets. India’s per-head figure is the lowest even though its total is third, because 1.45 billion people produce 390,000 searches.
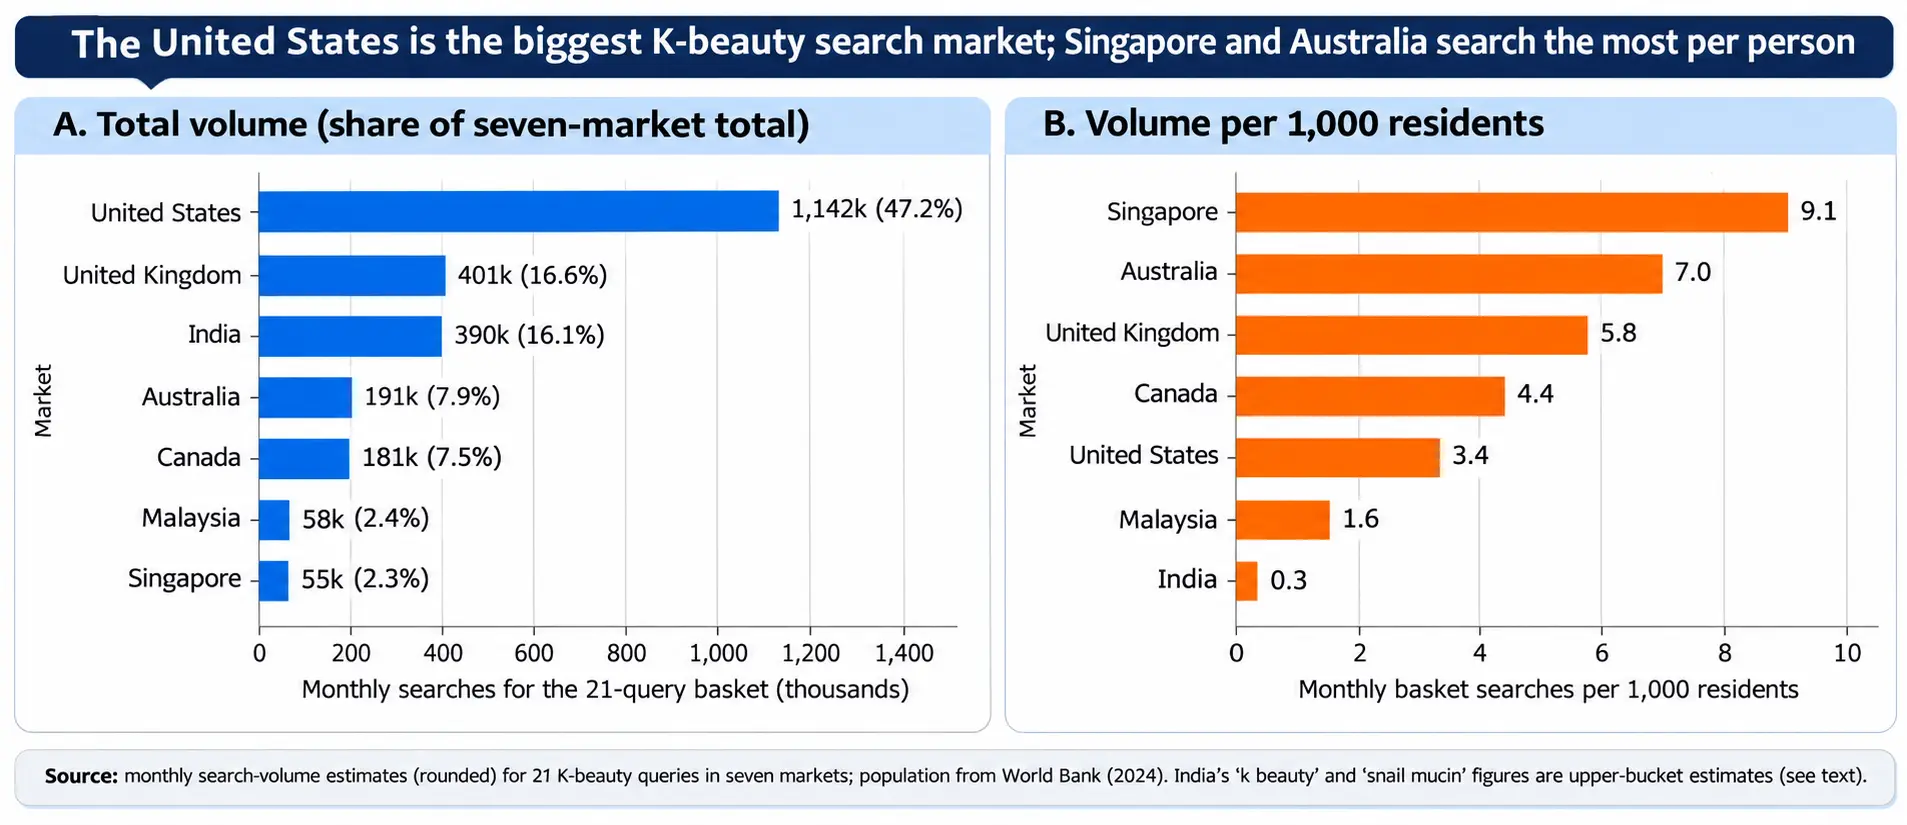
Chart 1: Monthly K-beauty basket searches by market, total and per 1,000 residents
| Market | Basket searches a month | Share of seven-market total | Per 1,000 residents | Brand share of basket | Largest single query |
| United States | 1,142,200 | 47.2% | 3.4 | 71% | medicube (301,000) |
| United Kingdom | 400,780 | 16.6% | 5.8 | 73% | medicube (135,000) |
| India | 390,000 | 16.1% | 0.3 | 37% | k beauty and snail mucin (74,000 each, see limits) |
| Australia | 191,340 | 7.9% | 7.0 | 64% | medicube (40,500) |
| Canada | 180,870 | 7.5% | 4.4 | 65% | medicube (40,500) |
| Malaysia | 58,230 | 2.4% | 1.6 | 82% | olive young and innisfree (12,100 each) |
| Singapore | 54,770 | 2.3% | 9.1 | 88% | olive young (22,200) |
Table 1. The seven-market demand table: monthly search-volume estimates (rounded) for 21 K-beauty queries, 2024 population from official statistics—full data in the accompanying file.
3. What each market searches for: brands in the West and South-East Asia, ingredients in India
Brand and retailer names make up most of the search basket almost everywhere: 88 per cent in Singapore, 82 in Malaysia, 73 in the United Kingdom, 71 in the United States, 65 in Canada, and 64 in Australia. India is the outlier at 37 per cent, with ingredients carrying 26 per cent of its basket against 3 to 7 per cent elsewhere, and product types 12 per cent.
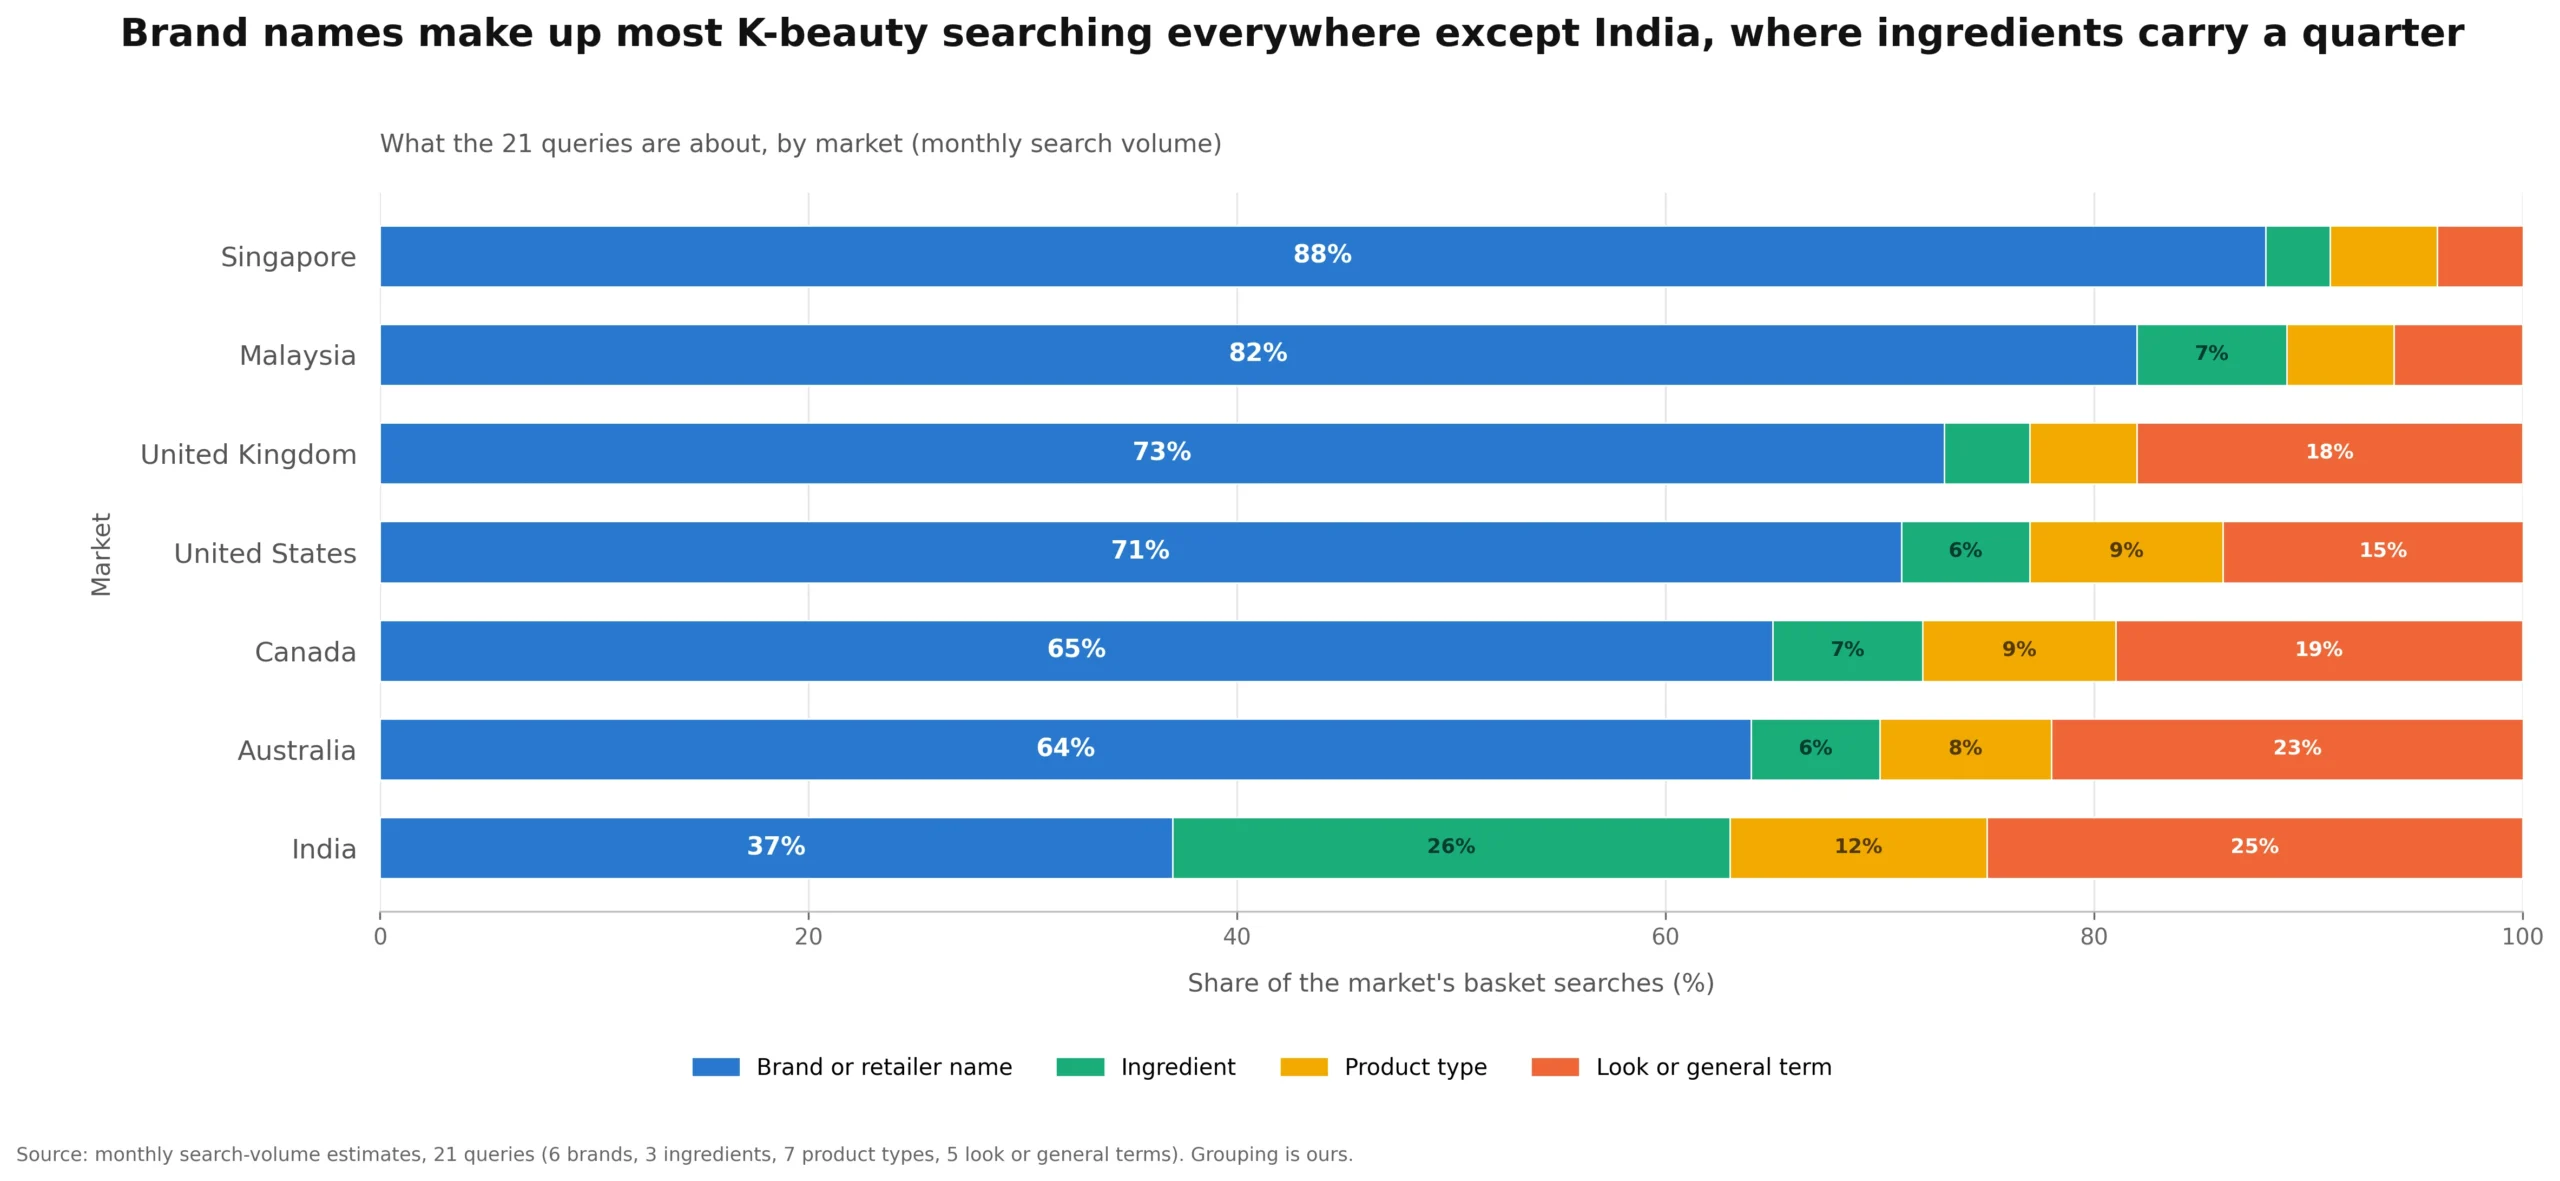
Chart 2: What the 21 queries are about, by market
India’s figures rest on two estimates that look capped: “k beauty” and “snail mucin” are both given as 74,000 a month, the same bucket. If we remove both queries, India’s ingredient share falls from 26 to 12 per cent and its brand share rises from 37 to 59 per cent. The direction survives (India is still the most ingredient-led market, and the least brand-led), but the size of the gap is less certain than the headline suggests.
The heat map below shows the same thing query by query, as a share of each market’s own basket, so markets of different size can be compared.
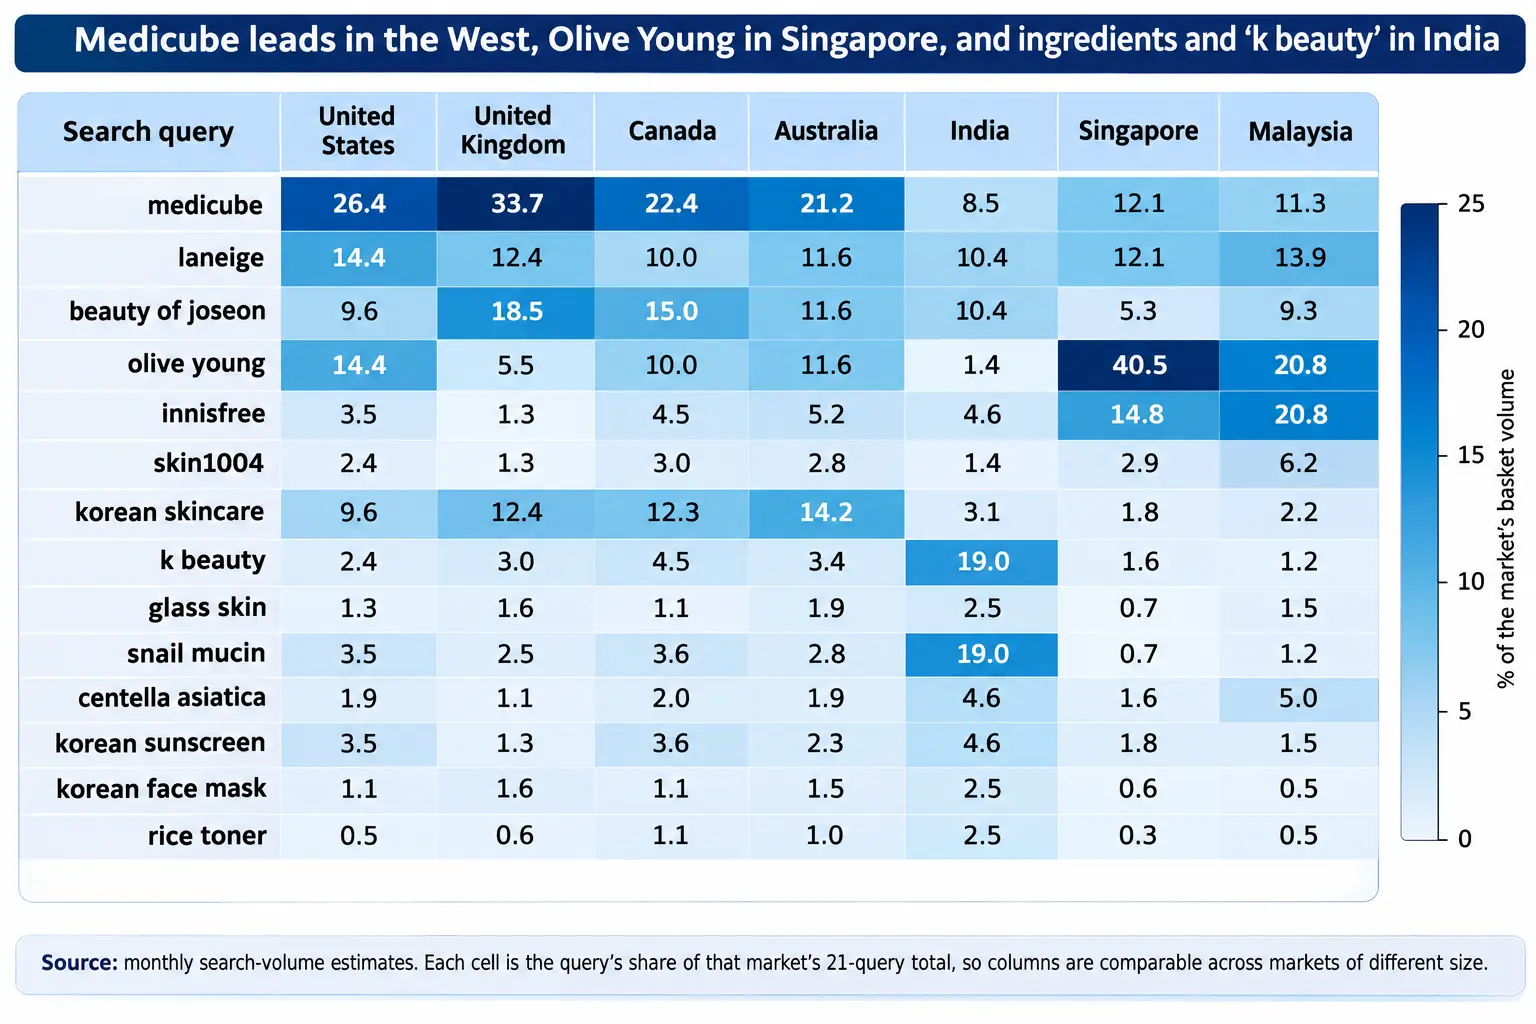
Chart 3: Share of each market’s basket volume taken by each query
Four patterns stand out. First, Medicube is a Western phenomenon in search: it takes 33.7 per cent of the United Kingdom’s basket and 26.4 per cent of the United States’, against 12.1 per cent in Singapore and 8.5 per cent in India. Second, in Singapore and Malaysia the retailer matters more than any brand: Olive Young takes 40.5 per cent of Singapore’s basket and 20.8 per cent of Malaysia’s, where Innisfree ties it. Third, “korean skincare” as a general phrase is a Western habit (14.2 per cent of Australia’s basket, 12.4 in the United Kingdom, 12.3 in Canada, but 1.8 in Singapore and 3.1 in India). Fourth, India’s mix is distinctive: “k beauty”, “snail mucin” and “rice toner” all take their largest basket share there, while Laneige and Beauty of Joseon tie as its top brands at 40,500 searches each.
Beauty of Joseon is the strongest brand in the British basket after Medicube (18.5 per cent against Medicube’s 33.7), and in Canada it is second (15.0). Laneige is steadier across markets, between 10.0 and 14.4 per cent in all seven. Retailer names carry caveats: searches for “olive young” in the United States (165,000 a month) will include people looking for stores or promotions, not only K-beauty shoppers.
4. Where the news is looking: a different map
News coverage geography is the third lens. Between 1 June 2025 and 31 May 2026 we counted 1,501 news and blog articles that mention K-beauty, up 68 per cent on the 894 of the previous 12 months. For 844 of the 1,392 articles matched in the recent window we could place the story in at least one country. Counting country labels, the United States gets 21.8 per cent, South Korea 17.0, China 7.1, the United Kingdom 6.0, Japan 6.0, France 5.2, India 3.9, Canada 3.9, Germany 3.5 and Indonesia 3.0.
Set that beside search and the maps part company. Across the 28 countries where we have both signals, the rank correlation between a country’s share of K-beauty news and its search intensity is 0.03, which is no relationship at all. In the earlier 12 months it was 0.38 across 25 countries, so even the weak link is not stable. Singapore, the United Arab Emirates and New Zealand are among the most search-intense countries in the world but together receive about 2.2 per cent of the news labels. Japan, France, Germany, Indonesia and the Philippines receive 2.6 to 6.0 per cent each but score between 9 and 23 on search intensity. China is the third most-covered country with no search data at all.
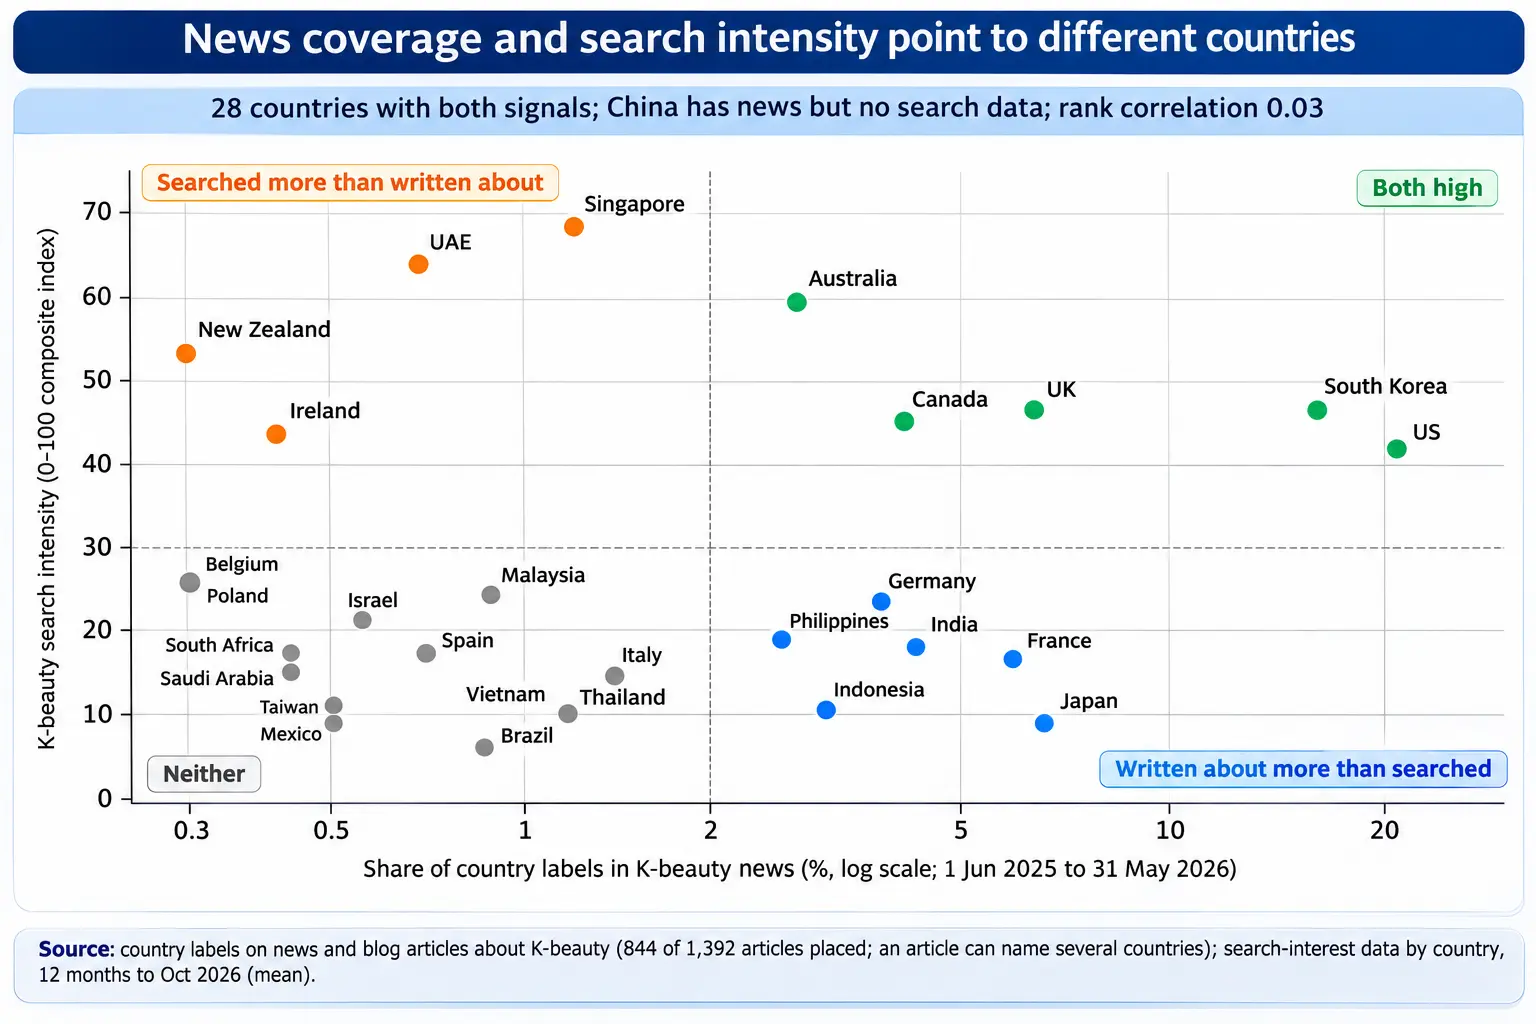
Chart 4: Share of K-beauty news by country against search intensity
Inside the seven markets the two signals agree more closely on size. The United States takes 54.2 per cent of the seven markets’ news labels and 47.2 per cent of their search volume; the United Kingdom 14.9 and 16.6; Canada 9.6 and 7.5; Australia 6.1 and 7.9; Malaysia 2.4 and 2.4; Singapore 3.0 and 2.3. India is the exception: 9.7 per cent of the news but 16.1 per cent of the search volume (and under the flagged-bucket caveat, probably less). The news writes about India less than its searchers would predict.
Individual brands and ingredients each have their own news geography. Olive Young coverage is split between South Korea (25.5 per cent of country labels) and the United States (23.9), with Singapore getting 2.4 per cent, four times its share of all news. Laneige coverage is 27.7 per cent American and 11.6 per cent British, with Italy at 4.6. PDRN, a skincare ingredient, is 26.1 per cent American, 12.9 per cent South Korean and 6.6 per cent Japanese. Coverage of “Korean sunscreen” is thin: 32 matching articles in two years, and half of the country labels on the 18 we could place are American.
Trade flows: exports point to China and Japan more than search does
South Korea’s Ministry of Food and Drug Safety reports that cosmetics exports reached a record US$11.43 billion in 2025, up 12.3 per cent (Korea JoongAng Daily, 2026; Personal Care Magazine, 2026). The United States was the largest destination at about US$2.2 billion, or 19 per cent of the total, ahead of China at US$2.0 billion (17.5 per cent) and Japan at US$1.1 billion (9.6 per cent). The combined share of the United States and China fell to 36.7 per cent from 43.1 per cent, and the number of destination countries rose from 172 to 202.
This is a third geography. Japan is about 10 per cent of exports and 6 per cent of the news labels but scores only 9 on English search intensity. China is 17.5 per cent of exports and 7 per cent of the news, with nothing in our search data. Neither signal is wrong; exports and English search measure different people. A map of K-beauty demand built from English search alone would miss two of the three biggest buyers.
5. News themes: what is rising and falling in Korean skincare coverage
We compared the themes of news and blog coverage mentioning “Korean skincare” across two equal windows: 1 June 2025 to 31 May 2026, and the 12 months before. We stopped on 31 May 2026 because news collection thins afterwards and a part-filled month would look like a fall. The bases are modest (979 and 1,185 labelled articles for categories, 500 and 755 for the taxonomy), so we show a z statistic for each change; a value below 2 in size is within noise. An article carries several labels, so shares do not add to 100.
The themes, in plain language:
- Import and export and economy and trade: trade statistics, tariffs and shipping.
- Fashion: style stories that mention Korean skincare.
- Product reviews and price comparisons: shopping guides.
- Retail: stores, retailers and sales.
- Skin and nail care: the main skin-care product and routine label.
- Beauty and health and wellness, health: umbrella labels.
- Cosmetic procedures: clinic and procedure coverage.
Rising:
Import and export went from 0.4 to 5.7 per cent of articles and economy and trade from 0.3 to 3.8 per cent, but both are noise of a particular kind, explained below. Fashion rose from 1.9 to 3.5 per cent (z 2.2, the only charted rising theme beyond chance apart from the trade pair), product reviews and price comparisons from 1.6 to 3.2 per cent and retail from 1.7 to 2.8 per cent, both within noise.
Falling:
Skin and nail care dropped from 44.8 to 28.2 per cent (z -6.0), beauty from 22.3 to 18.1 per cent, health from 5.6 to 3.5 per cent, health and wellness from 12.5 to 10.0 per cent (within noise) and cosmetic procedures from 2.4 to 0.4 per cent, though that rests on three articles in the recent window.
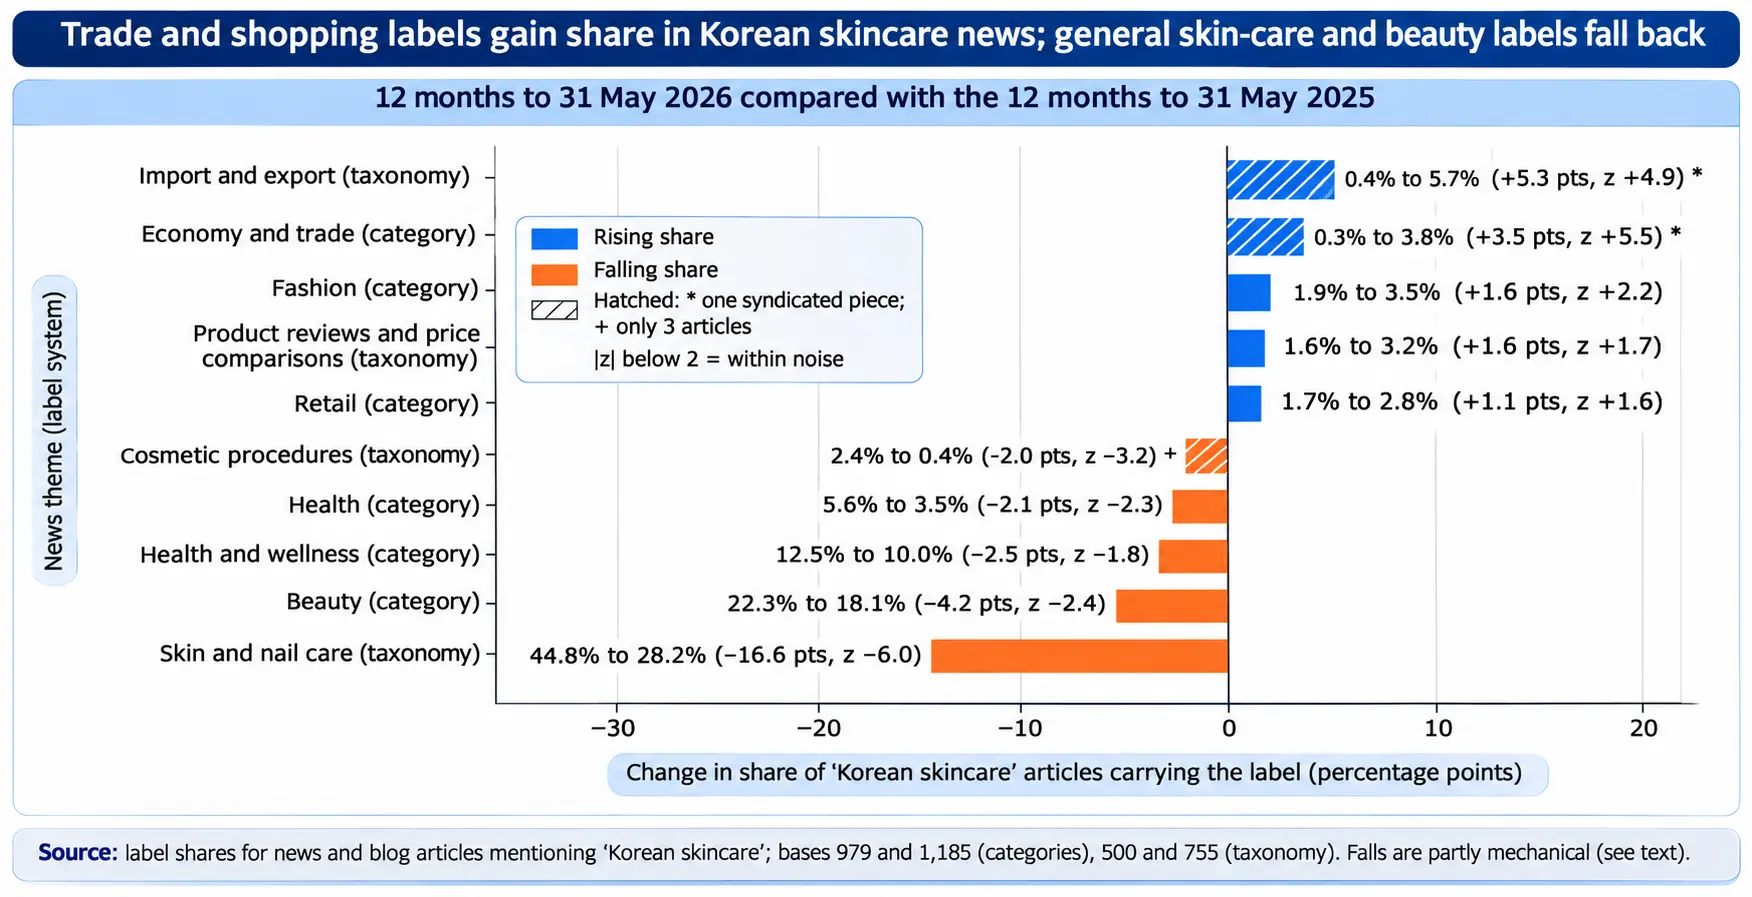
Chart 5: Change in share of Korean skincare coverage by theme, 12 months to May 2026 against the previous 12 months
The trade “trend” is one syndicated piece:
In September 2025 a data-journalism article about national import and export statistics, which mentions Korean skincare only in its opening sentence, appears in 43 articles with identical tags, nearly all on one day; we read this as a single syndicated release. In that month 42 of 64 Korean skincare articles carry the import-and-export label; in every other month of the 24 the count is zero or one. The same piece explains why Brazil appears with 13.3 per cent of the country labels on Korean skincare news in the recent window, against 0.9 per cent in the wider K-beauty news; the same opening sentence mentions Brazil. We read it as a labelling and syndication artefact, not demand in Brazil. The falls are partly mechanical too: 43 extra trade articles enlarge the recent base, so every other label’s share is squeezed. If none of the 43 carried the skin-and-nail label, its share would be about 30 per cent, still well below 44.8.
Two cautions follow. Coverage of K-beauty as a whole did grow, so a label can lose share while gaining articles: skin and nail care held at about 213 to 224 articles in both windows. And the umbrella labels (beauty, health and wellness, business) change as more specific labels enter, not because readers lose interest.
6. What the map suggests for 2027
This is a reading of today’s data, not a forecast. First, a brand-led market and an ingredient-led market need different messages: Singapore, Malaysia, the United Kingdom and the United States search for names, India for ingredients and looks. Second, the retailer is the brand in South-East Asia: Olive Young, not a product label, leads Singapore and Malaysia and is the top brand query in South Korea and Taiwan. Third, the highest search intensity sits in small English-speaking and Gulf markets (Singapore, the UAE, Australia, New Zealand), where absolute volume is modest. Fourth, no single signal covers the category: English search misses Japan and China, news over-reports Korea, and exports are tied to a different list of buyers. A market map that uses only one of the three would rank the world differently.
Methodology and limitations
Audience searches:
Monthly search volumes are rounded estimates for 21 queries in seven markets (US, UK, Canada, Australia, India, Singapore, Malaysia). We examined the 24 queries with the highest US search volume in a pool of 41 K-beauty seed queries; 21 have a volume in all seven markets, while three (Anua, COSRX and Torriden) were measured in only some and are left out of the seven-market totals. We could not source the top 25 the pitch promised: 24 were examined, 21 of them in all seven markets. Relative country-level search interest comes from search-interest series for the 12 months to late October 2026: ten single-query requests (composite index) and four multi-query comparison requests (brand and product leaders). In a comparison request values are each query’s share of the requested queries within a country, which is why we use them for leaders, not for levels. Brand-set comparisons are joined through Medicube, which appears in both sets. Countries with too little volume are returned as “no data”; we kept 65 countries that have data in at least five of the ten composite queries, and dropped one tiny territory with unstable values.
News:
Counts are numbers of news and blog articles mentioning the term over 1 June 2024 to 31 May 2026. Country placement is the country an article is about, resolved for 60.6 per cent of recent-window articles; shares are of country labels, and an article can carry more than one. Theme shares for “Korean skincare” use the label panels’ own denominators (979 and 1,185 for categories, 500 and 755 for the taxonomy), so they are not comparable with the K-beauty monthly counts, which use a narrower match (249 and 305 monthly articles for Korean skincare in the two windows). News ingest thins after May 2026, so no later period is used.
Trade:
Export figures are secondary: they come from press reports of the Ministry of Food and Drug Safety release of January 2026, and we did not have destination-level tables, so ranks below Japan are not shown. We did not build a trade-flow dataset; the pitch mentioned trade flows, and what we deliver is the headline export geography only.
Not delivered:
We did not use sub-national geography, research-paper counts or sales data. Search volume history is not available beyond a few months, so no trend by market is claimed.
Limits:
Search is curiosity, not purchase. English-language queries under-count Japan, China, Brazil, Mexico, Thailand and Vietnam. India’s “k beauty” and “snail mucin” volumes look capped at the same bucket, and retailer names include store-finding searches. The composite index weights ten queries equally, which is a choice. The rank correlations rest on 25 to 28 countries and a single measurement window.
Data and analysis:
The news, search and research-paper analysis in this article was run with Fliar Prism (Fliar Business Intelligence, 2026a), and the research tools it uses are published as the open-source Prism MCP (Fliar Business Intelligence, 2026b).
References
- Fliar Business Intelligence (2026a) Fliar Prism: news, search and research-paper analysis [Data and analysis platform]. Available at: https://fliarbi.com/prism/ (Accessed: 27 October 2026).
- Fliar Business Intelligence (2026b) Prism MCP: open-source research tools [Software]. GitHub. Available at: https://github.com/fliarbi/prism-mcp (Accessed: 27 October 2026).
- Korea JoongAng Daily (2026) ‘Korea’s cosmetics exports surpass record $11 billion in 2025’, 9 January. Available at: https://www.koreajoongangdaily.com/business/koreas-cosmetics-exports-surpass-record-11-billion-in-2025/12129724 (Accessed: 27 October 2026).
- Personal Care Magazine (2026) ‘Korean cosmetics exports hit $11 billion record high in 2025’, 12 January. Available at: https://www.personalcaremagazine.com/story/50378/korean-cosmetics-exports-hit-11-billion-record-high-in-2025 (Accessed: 27 October 2026).
- World Bank (2025) Population, total (SP.POP.TOTL) [Dataset]. Available at: https://data.worldbank.org/indicator/SP.POP.TOTL (Accessed: 27 October 2026).
You May Also Like


Leave Your Comment: